Our Service
For those who report and those who receive: a next-generation incident management system that reduces frontline burden and frees time for analysis and countermeasures.
Features that answer frontline challenges
How Zeroharm's features respond to the many challenges of the frontline.
FEATURE 01 ─ Effortless reporting
Lighten the reporter's load and energize your reporting culture
"I'm too busy — there's no time to write reports…"
─ Reporter (healthcare worker)
Report fields switch automatically per case
Purpose-built fields refined in real clinical settings mean a report is complete with minimal typing.
Report anonymously if you prefer
Reports can be submitted with or without your name, easing psychological stress and encouraging reporting.
Report from your smartphone
No waiting for a free PC — report on the spot, wherever your work takes you.
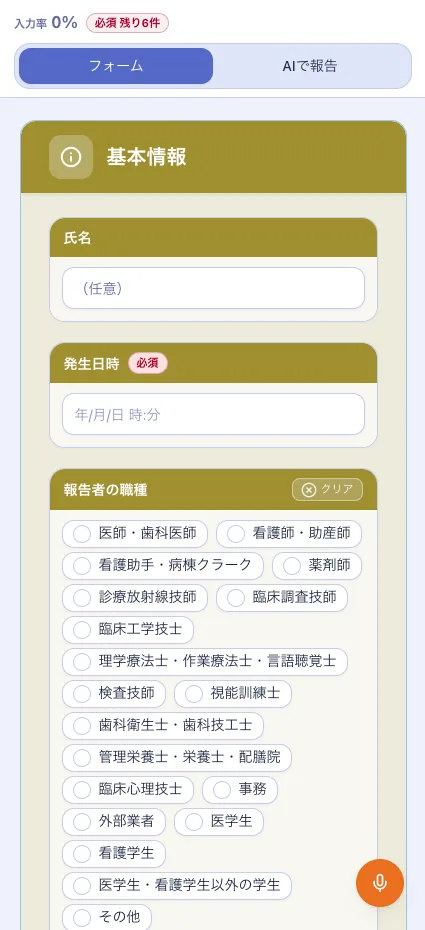
EFFECTReport on the spot, in 3–4 minutes on average
FEATURE 02 ─ Efficient safety management
Daily review and tallying — faster and clearer
"I'm so busy checking and tallying reports that analysis never happens…"
─ Patient safety manager
Clear reporting in SBAR format
The SBAR reporting format makes content clear, reduces follow-up questions to reporters, and helps reporters learn SBAR.
Lists and read status at a glance
See the report list, department managers' review status, and unread items on a single screen.
Fast search with combined conditions
Reach the reports you need in seconds by period, department, incident type, free text, and more.
Tally and chart in a few clicks
Draw Pareto charts, simple tallies, and control charts (with sigma lines) just by picking conditions — then export them as images or numbers.
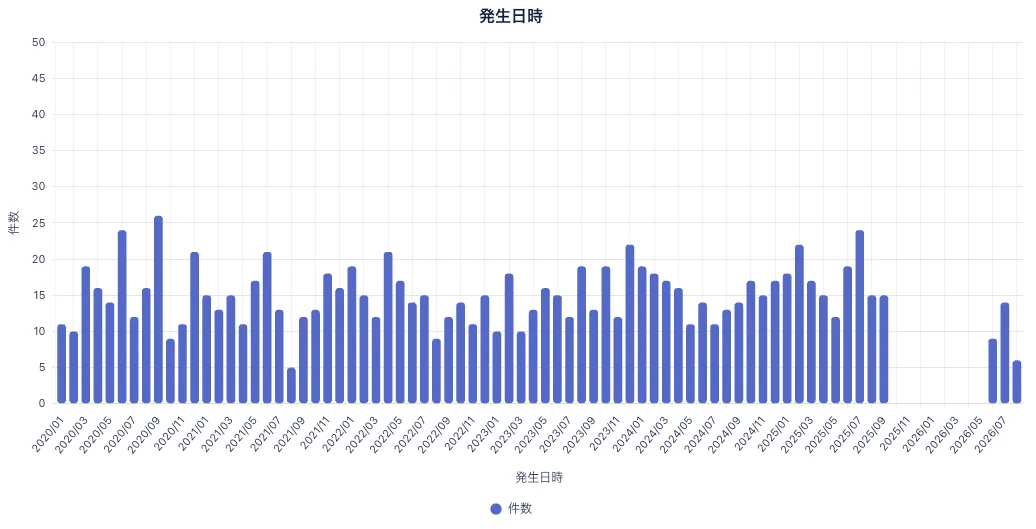
Simple tally (bar): incidents per month 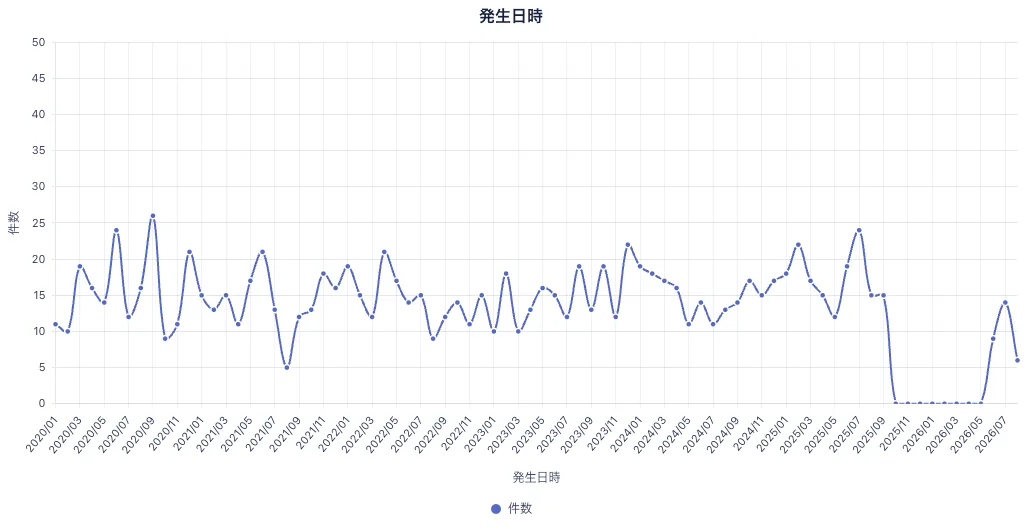
Simple tally (line): count trends 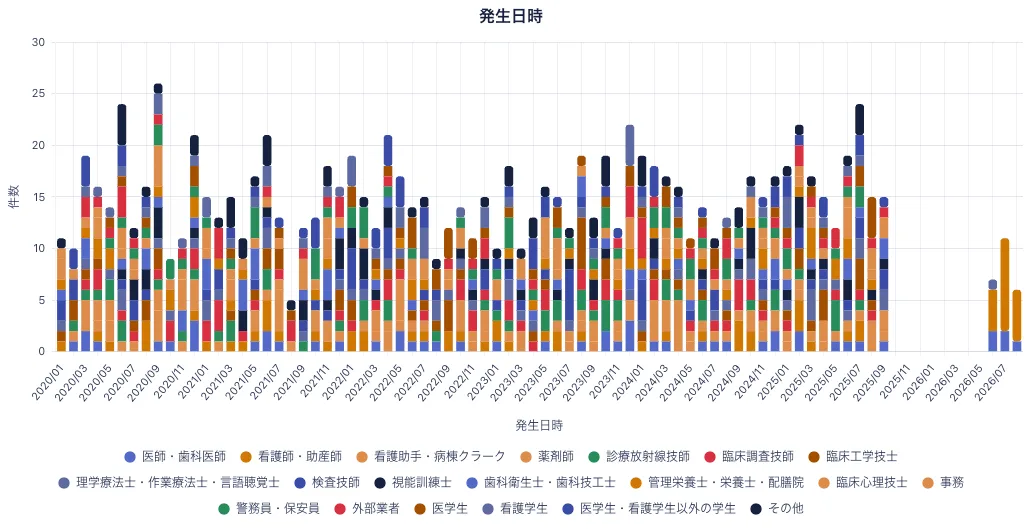
Stacked tally: breakdown by profession 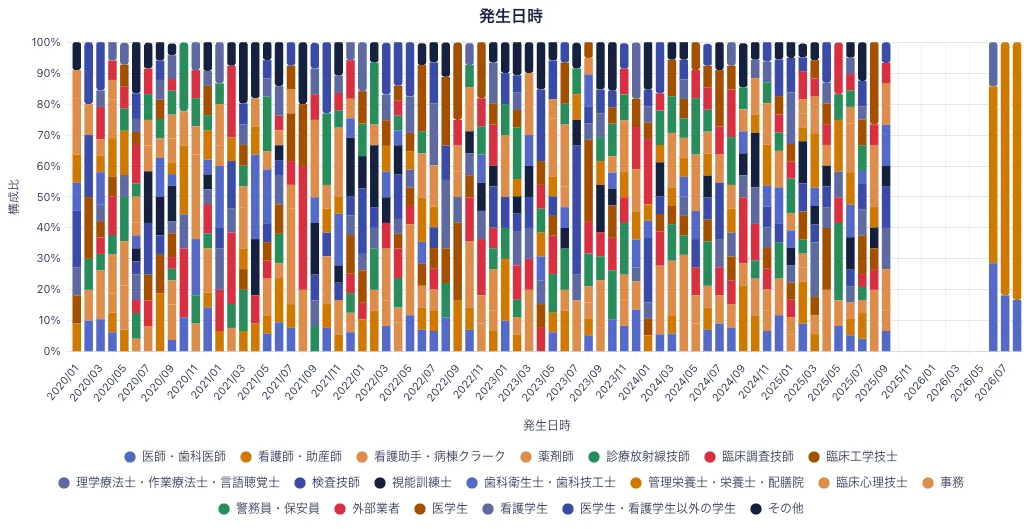
Composition: share by profession over time 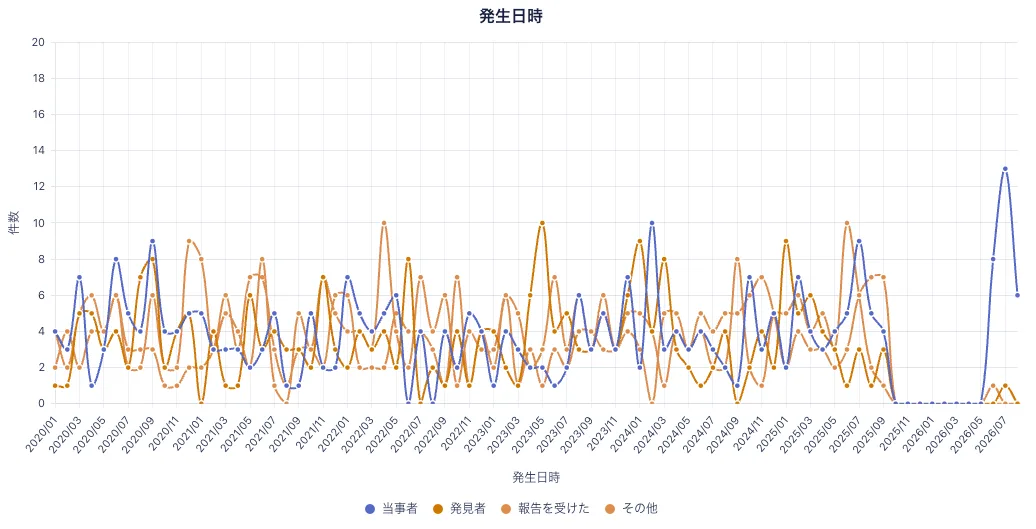
Trends by involvement: party, discoverer, informed 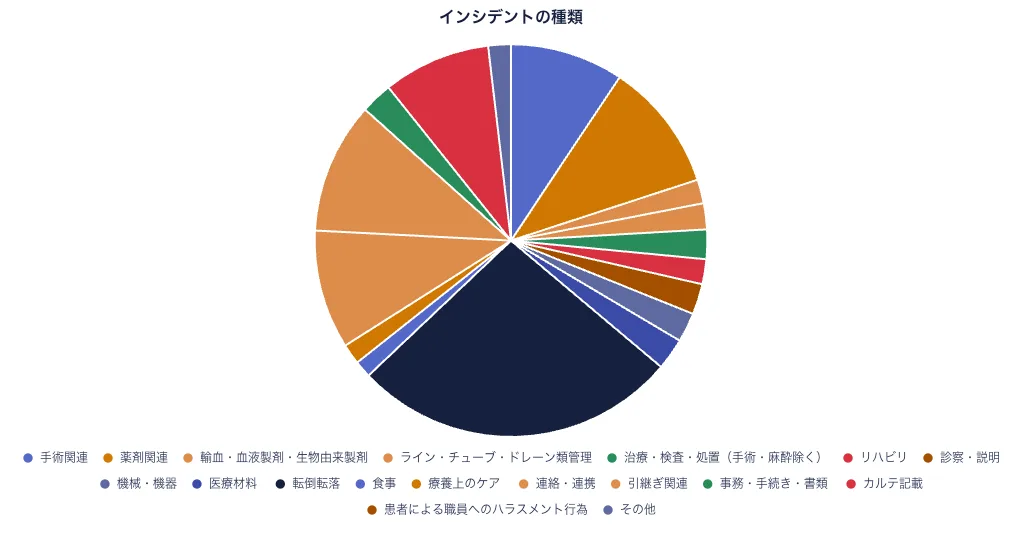
Pie chart: share of incident types 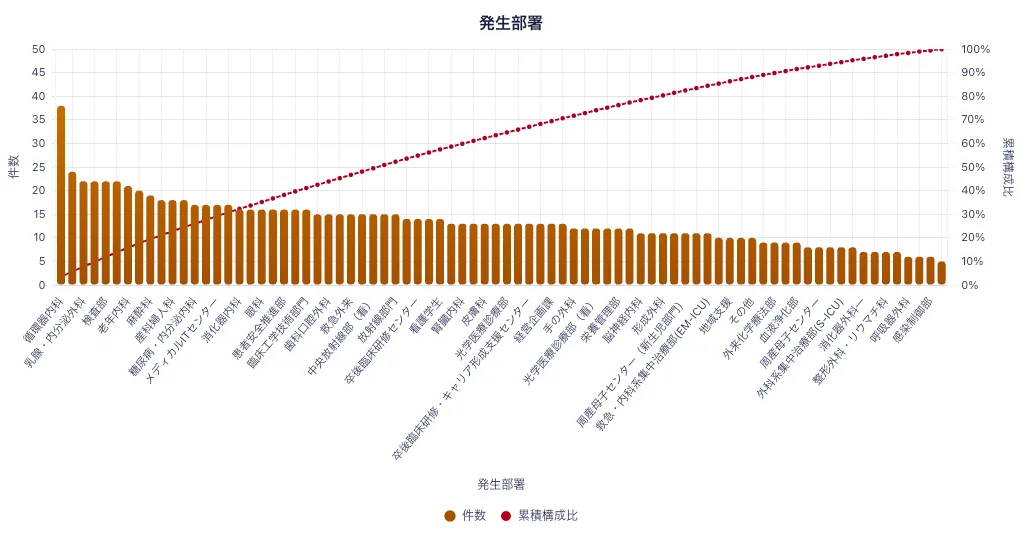
Pareto chart: see at a glance which departments need focus 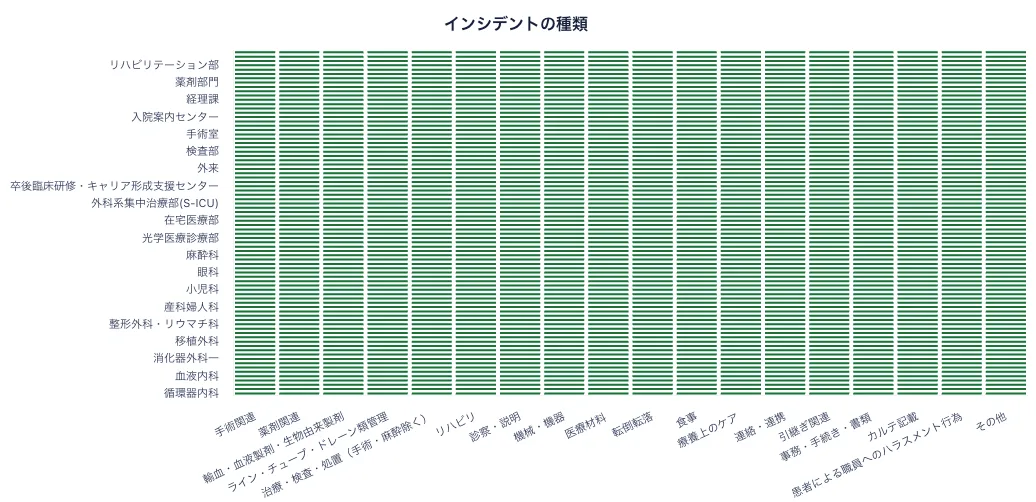
Matrix: department × type cross tally 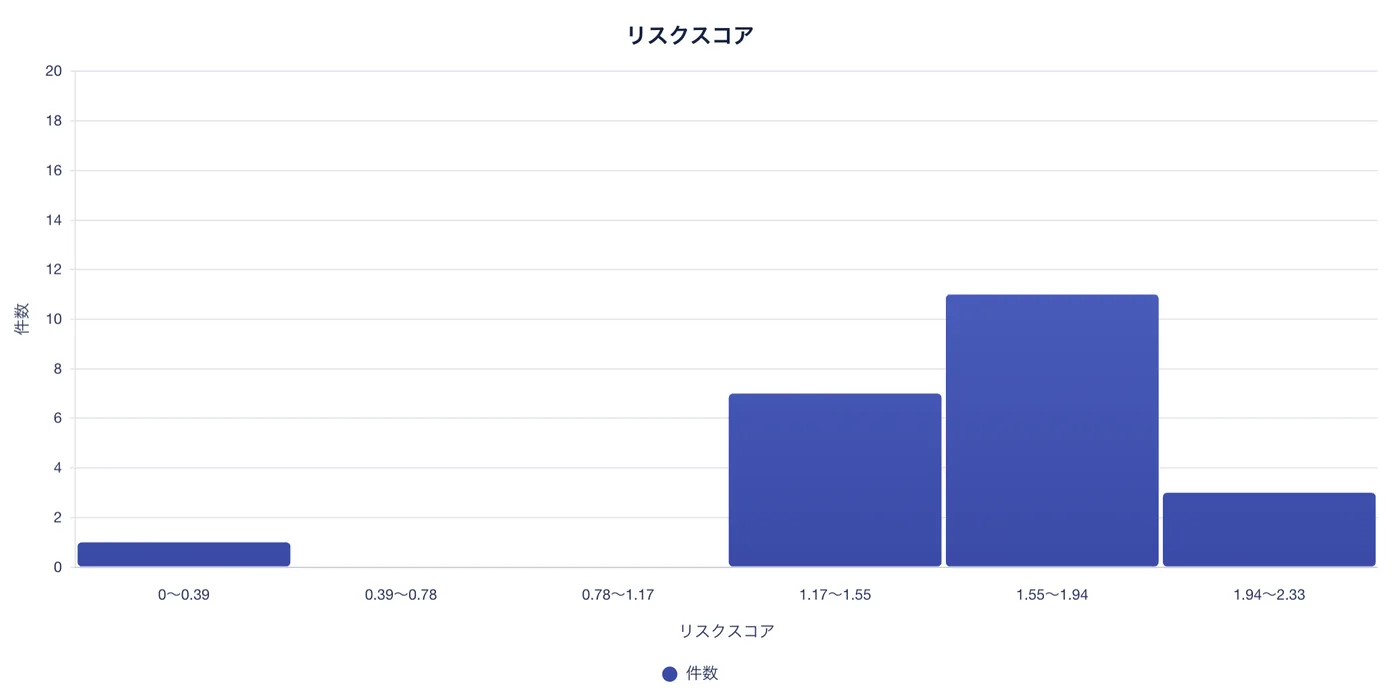
Histogram: risk score distribution 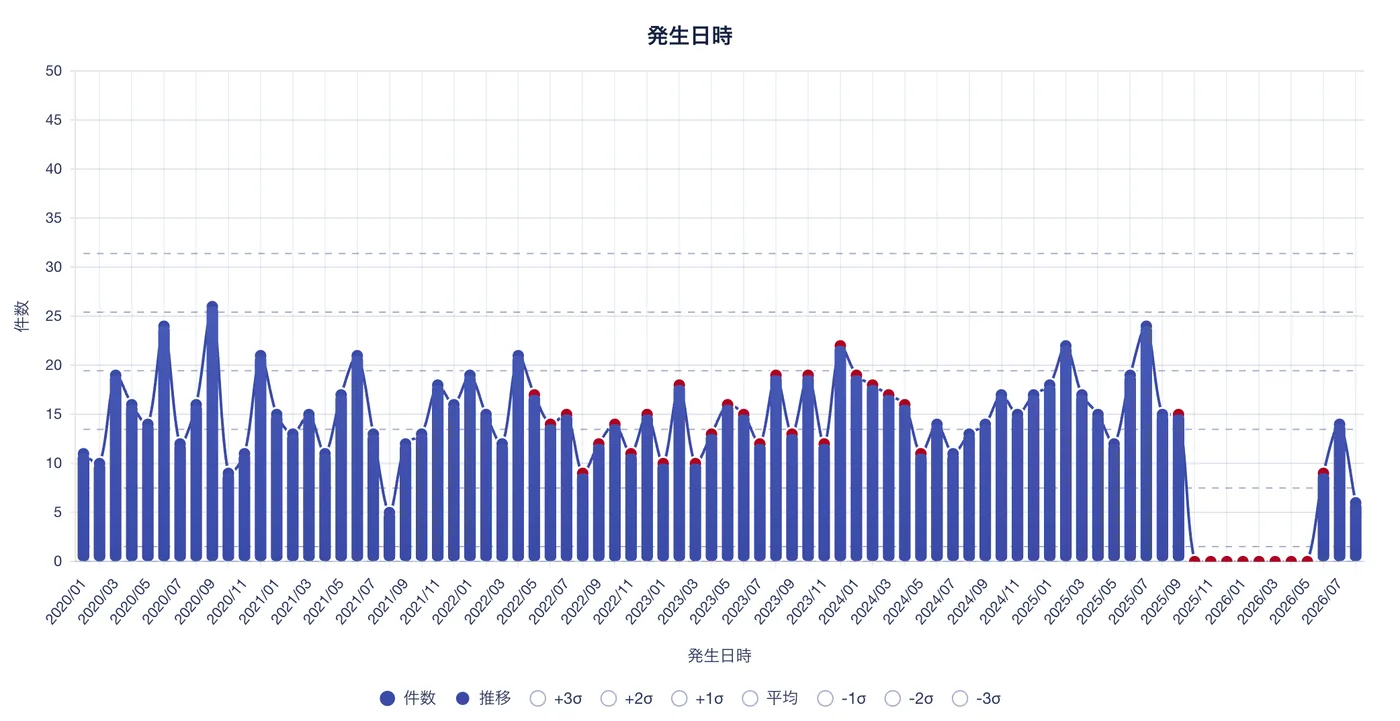
Control chart: sigma lines flag unusual variation
EFFECTCut review and tallying time, and spend it on analysis
FEATURE 03 ─ Risk-measurement AI
Never miss the early signs of risk
"I want to catch the signs that lead to serious accidents sooner…"
─ Patient safety manager
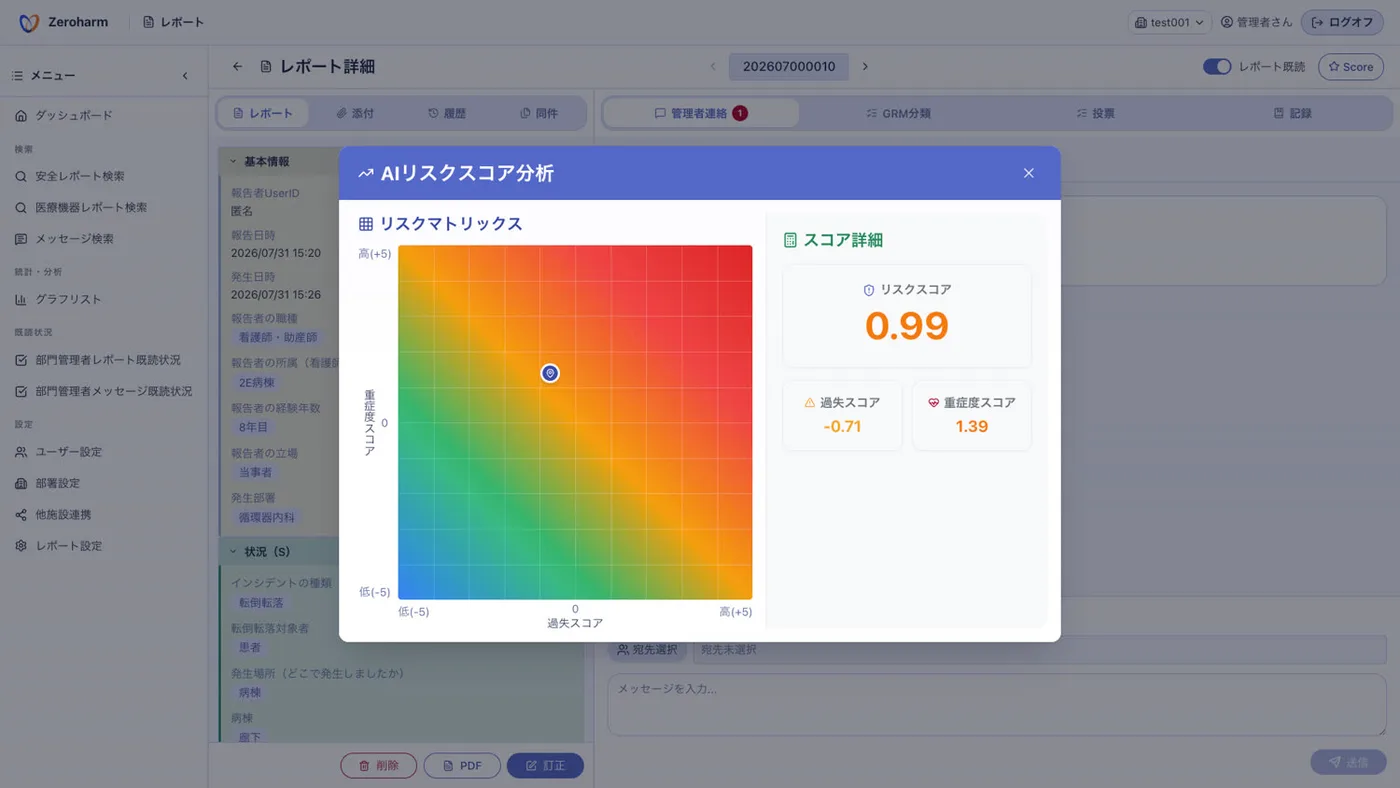
Automatic risk scores for every report
An AI trained on 120,000 real clinical incident reports automatically scores importance along the two axes of fault and severity.
A risk matrix that won't let serious risks slip by
Scores are visualized on a matrix, so easily-buried high-risk reports stand out the same day.
Detect unusual signs in risk trends
Score statistics visualize your facility's risk level over time, so you notice unusual movement early and prevent serious events.
EFFECTGet ahead of the signs of serious events
FEATURE 04 ─ AI-assisted report writing
Talk, answer, done — your report completes itself
"I'm not good with systems — I'm worried I can't fill this in right…"
─ Reporter (healthcare worker)
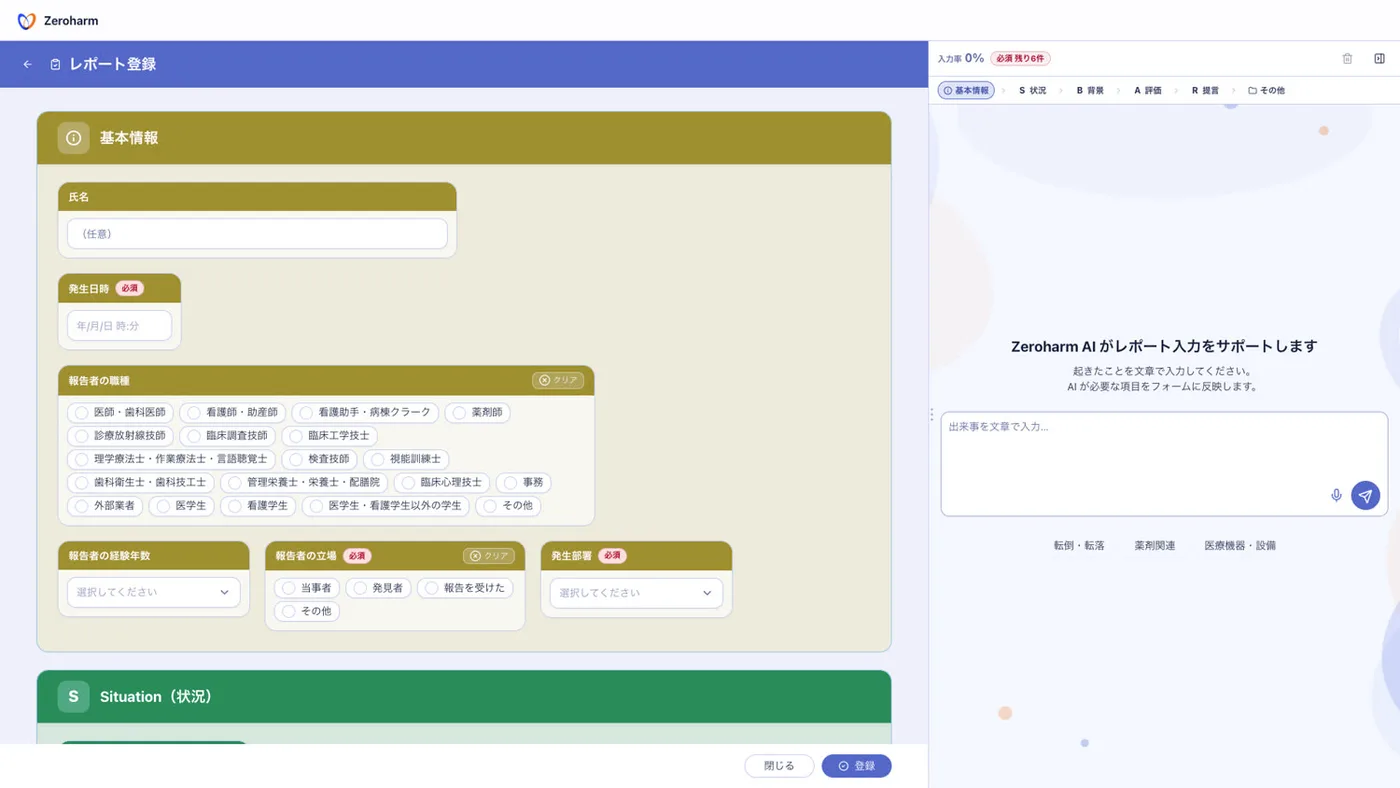
Conversational AI input support
Describe what happened in plain text and the AI fills in the form, asking questions to cover anything missing.
Voice input, too
No typing needed — what you say becomes the input. Recognition of medical terms keeps improving.
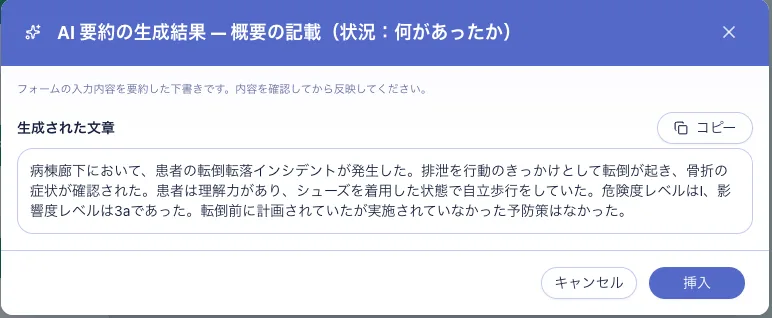
AI summary — text drafted from what you checked
The AI drafts the summary from your form selections, so you never enter the same information twice.
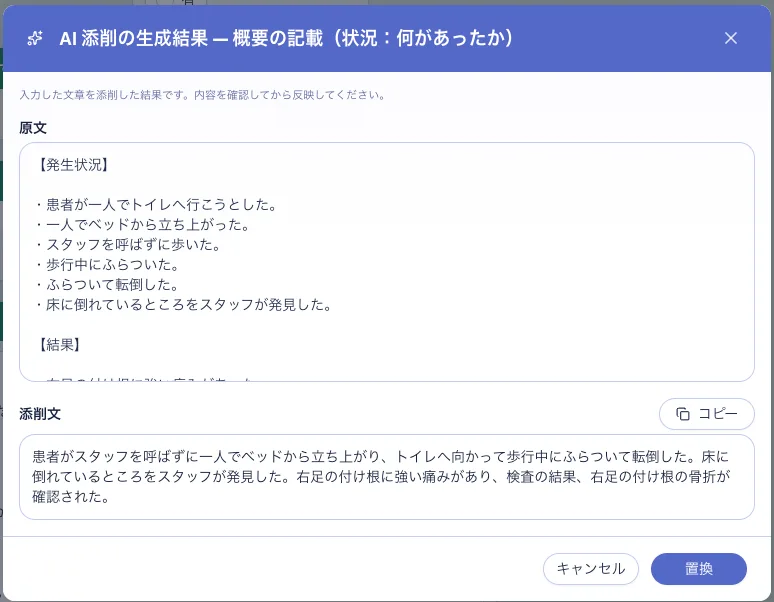
AI proofreading — readable prose from anyone's draft
The AI polishes bullet points and rambling drafts. Compare with the original and click 'Replace' — that's it.
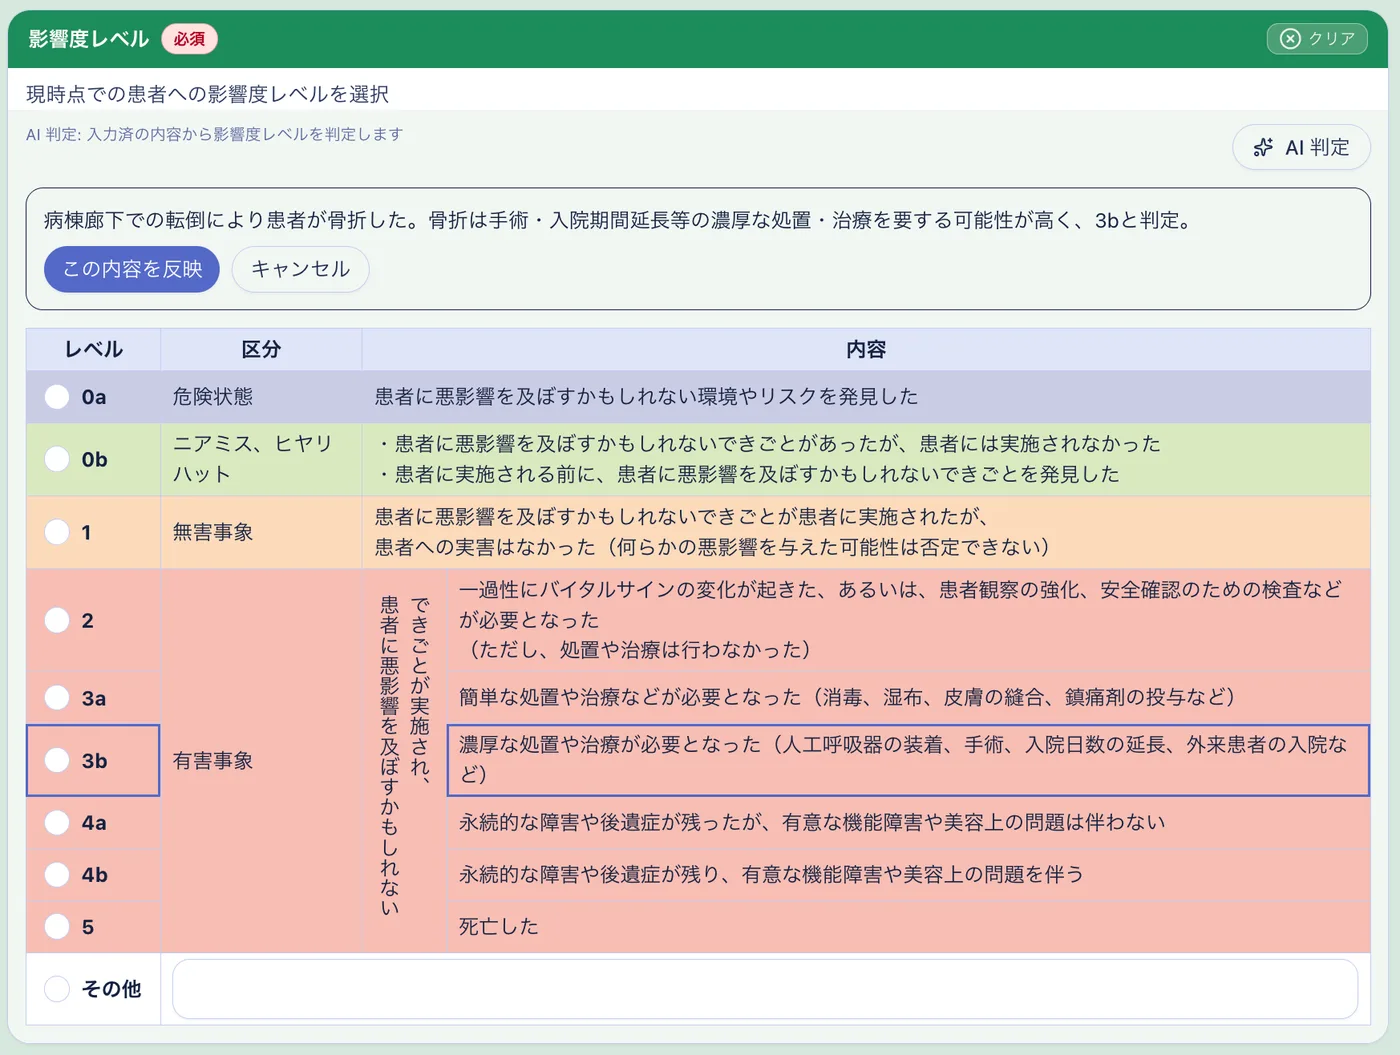
Automatic impact-level assessment
For tricky 0a–5 calls like 3b vs. 4a, the AI proposes a level with its reasoning — just review and apply.
EFFECTEven the tech-shy can report without hesitation or mistakes
FEATURE 06 ─ Custom reports of every kind
Create as many of your own report types as you need
"Everything besides incidents is scattered across paper and Excel…"
─ Patient safety manager
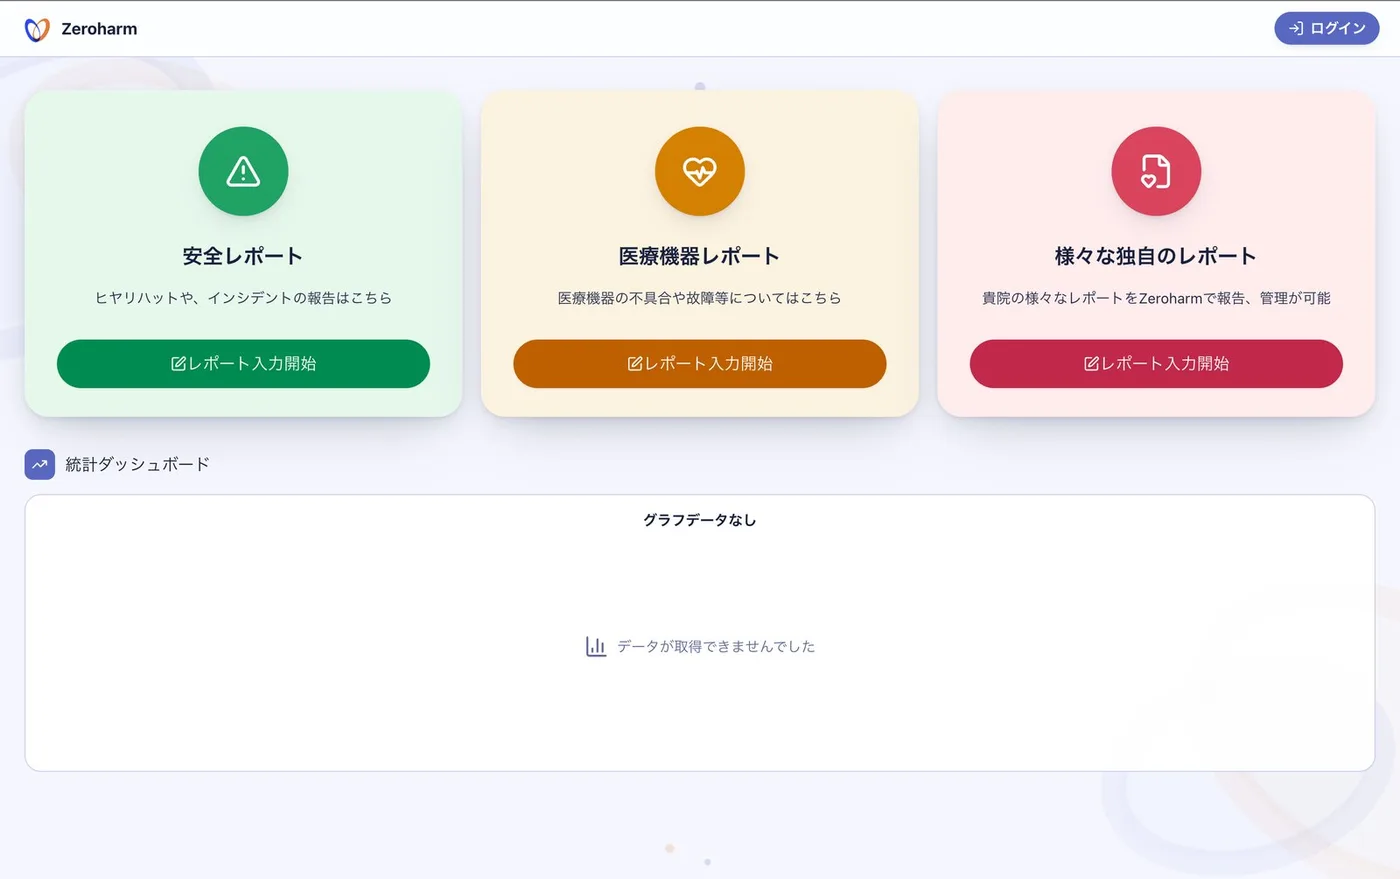
Medical device reports built in
A dedicated report handles device malfunctions, failures, and similar events.
Build original reports freely
Configure fields to match your operations and create as many custom reports as you like — all kinds of reporting can live in Zeroharm.
One place from reporting to management
Reporting feels the same as safety reports, and lists, search, and tallies all complete inside Zeroharm.
EFFECTBring your hospital's many reports together in Zeroharm